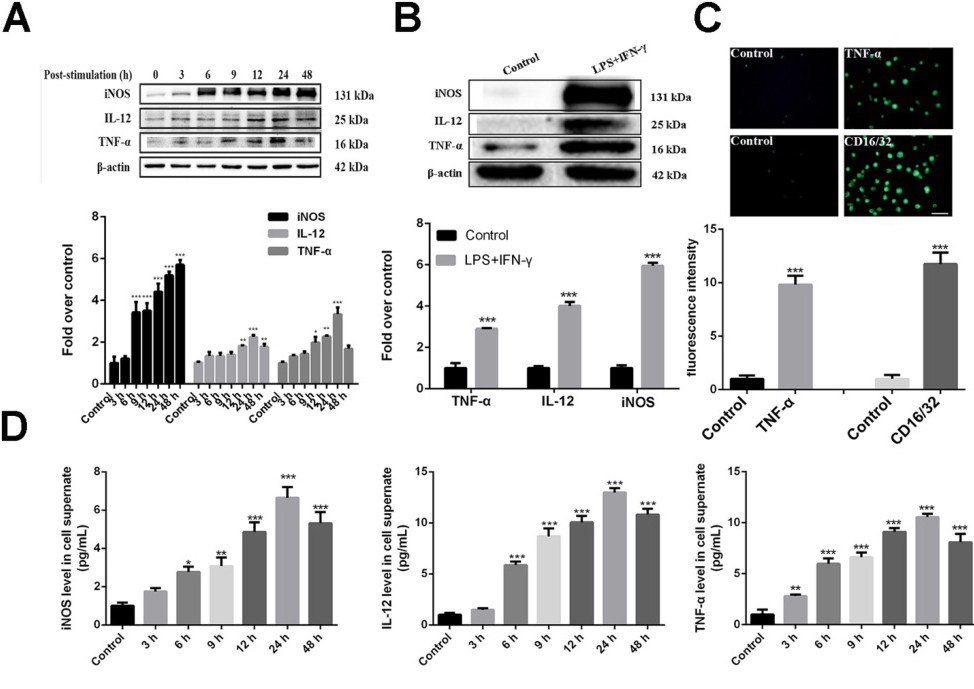
Fig. 1. Establishment of the M1 peritoneal macrophage model. (A) The expression of iNOS, IL-12 and TNF-α at different induction times was determined by western blotting (n = 3). (B) Western blot analysis of expression of iNOS, IL-12, and TNF-α after 24 h induction (n = 3). (C) Fluorescence assay analysis of TNF-α and CD16/32 after induction for 24 h (scale bar: 50 µm) (n = 10). (D) The secretion of pro-inflammatory factors at different induction times was determined by the ELISA assay (n = 10). * P<0.05, ** P<0.01, *** P<0.001 vs control group.